Beyond Uptime: Why Response Time and TTFB Belong in Your Monitoring
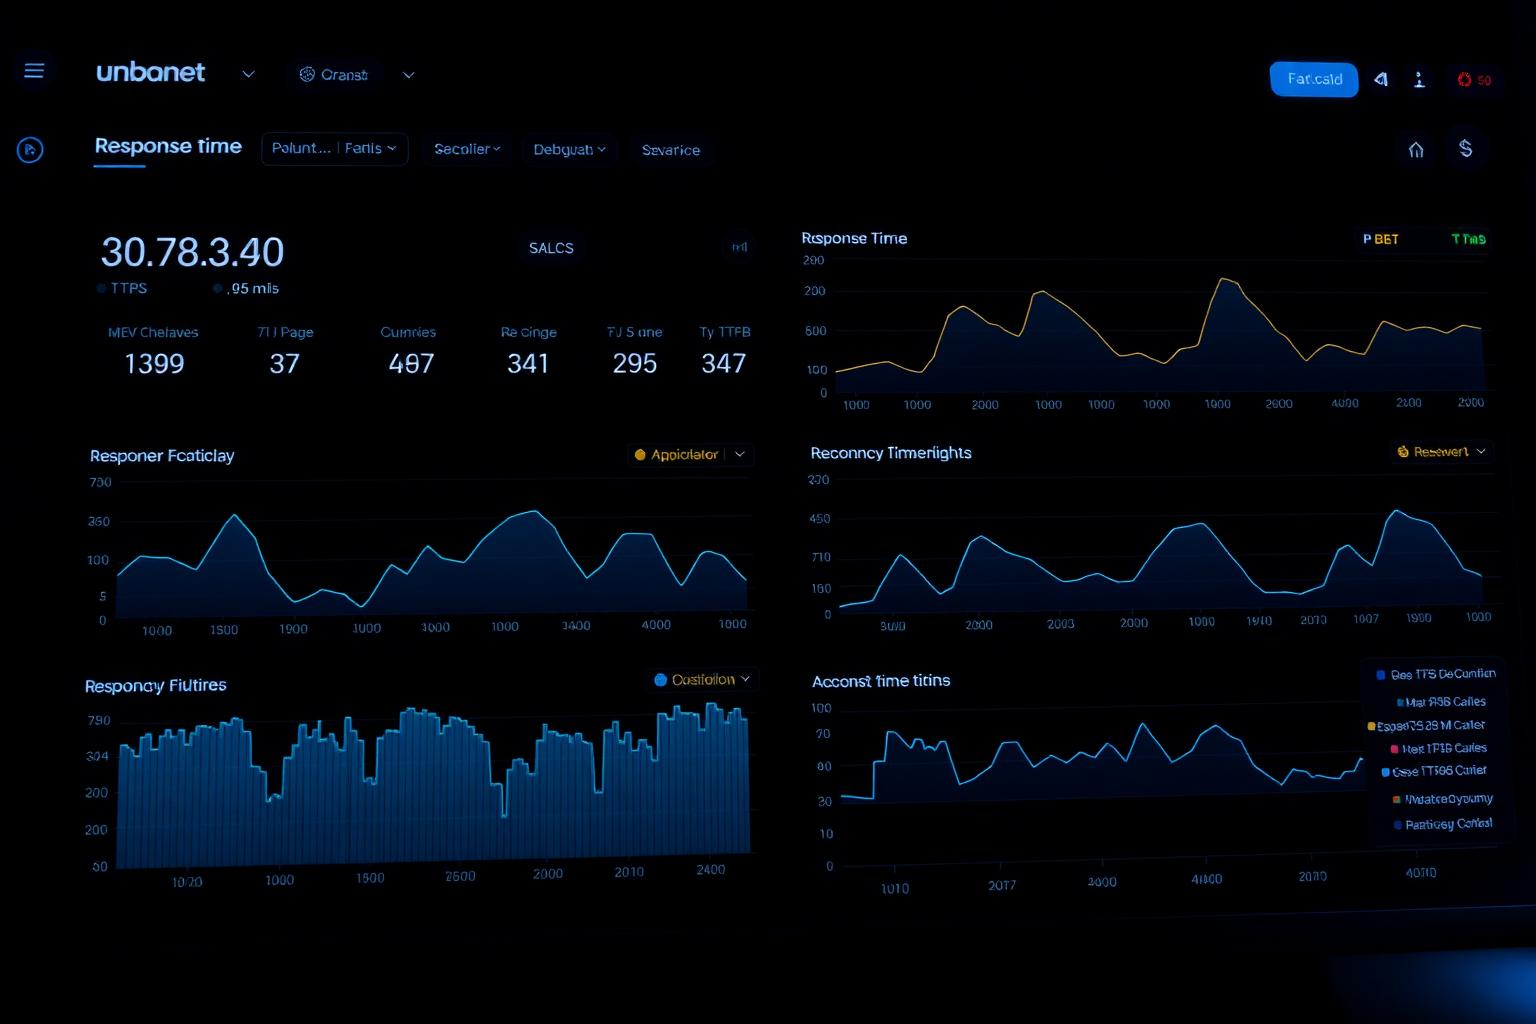
Plenty of outages do not return 500. The site loads, the monitor is green, and conversion rates are down 18% because every page now takes 6 seconds to render. If you are only tracking up/down, you have no idea this is happening until someone complains.
What "up" really means
A monitor that flips to "down" only on connection failures or 5xx responses misses the most common production problem: slow responses. A 4-second TTFB is functionally an outage for any user on a flaky mobile connection—they tap away long before the page renders.
Useful latency signals
Time to First Byte (TTFB): origin and CDN health in one number.
Total response time: includes payload transfer, useful for tracking page weight regressions.
Per-region response time: catches CDN PoP issues invisible from the origin region.
p95/p99 over time: averages hide the tail latency that real users feel.
Setting response-time thresholds
Static thresholds (alert if response > 2000ms) work for stable workloads. Dynamic thresholds (alert if response > 2x last 7-day baseline) are better for sites with traffic variability. Start with static, refine as you learn what "normal" looks like.
Whatever threshold you pick, require multiple consecutive failed checks before alerting. One slow check does not mean the site is slow.
Reading response-time charts
Step change up after a deploy: the deploy is the suspect.
Slow drift up over weeks: capacity, dataset, or N+1 query growth.
Spikes at the same time daily: scheduled job competing for resources.
Spikes correlated with one region: CDN or routing, not origin.
How PingHarbor surfaces this
Every PingHarbor monitor records per-region response time on every check. The monitor detail view plots the last 24 hours, 7 days, and 30 days, with a comparison line for the previous period so regressions jump out.
You can configure response-time alerting independently from up/down alerts—useful for keeping a noisier "performance regression" channel separate from the on-call paging channel.
Slow is the new down. If your monitor cannot tell the difference, your customers will.